Today was clearly a risk off day, stocks down, commodities down, bonds up, gold up US$ up… you know the drill despite having done your best to erase those events from your memory since early February. Here was a decent size directional options trade in the SPY that caught my eye in today’s trade that I thought was worth breaking down:
SPY: total options volume was basically in line with the one month average, but put volume was 2x that of calls. The largest trade of the day in SPY options was a ratio put spread. When the etf was $204.60, a trader bought to open 17,500 of the May 13th weekly 204 puts for $3.35 and sold to open 35,000 of the May 13th weekly 195 puts for $1.19, netting a total debit of 97 cents, or $1.7 million in premium. This trade breaks-even at $203.03, offers a max profit potential of up to $8.03 between $203.03 and $195, with max gain at $195, or about $14 million. Because the trader has sold twice as many of the 195 puts as they are long of the 204 puts, the payout of the trade would trail off between 195 and $187.03, with losses below.
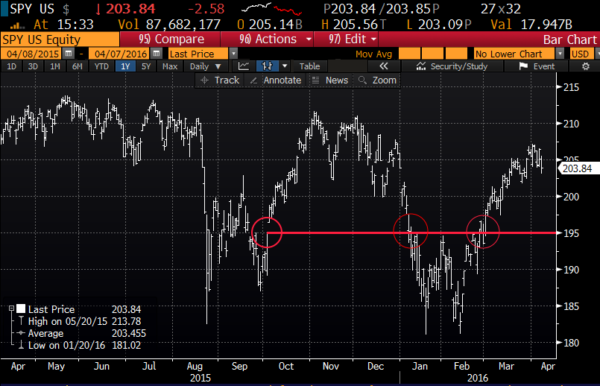
Why $195 to make the line in the sand? Well, it was an important gap reversal level from early October, possibly a breakdown level from early January and then a breakout level in late February:
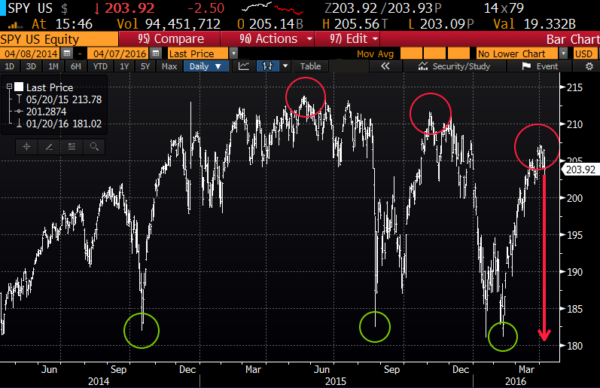
Regular readers and viewers of CNBC’s Fast Money and Options Action know that it is the following chart at the core of my bearish thesis for large cap U.S. equities. While the SPX has outperformed the Nasdaq and Russell 2000 from their all time highs made last year, the SPX is on my hit list because it did something in early February that it had not done since prior to the financial crisis and the SPX’s more than 50% peak to trough decline. On top of the series of lower highs that the SPX has made since last May, the intra-day low from February 11th was below the intra-day low of the flash crash in August and the October 2014 Ebola low. When I put the series of lower highs together, with the recent reversal, I spy a re-test of the February low at some point in 2016, and I don’t need to tell you what would happen if it makes a lower low (there is an air-pocket down to 1600):
Obviously this is just one man’s opinion, but what’s clear to me is that after a long period of QE & ZIRP induced low volatility, the SPX’s volatility bands have widened since the end of QE in Q4 2014, the Chinese Yuan deval in August 2015 and then in Jan/Feb after the end of ZIRP. After a more than 200% rally off of the financial crisis lows of March 2009, and trillions upon trillions of dollars of global monetary easing, I think the widening of volatility bands at a time when investors of risk assets are seriously questioning the continued effectiveness of such policies, which have now stretched to negative interests rates is less than bullish for stocks. Especially as equity markets like China, Europe and Japan struggle in 2016, all down double digits, despite continued easing. The chart above tells me one thing, that sentiment towards the SPX is shifting, and not for the better, and the price action could be building for the type of sell off occurred on August 24th.