Until the S&P 500 (SPX) makes a new all time high (less than 2% away), or fails in and around 2100 for the 7th time (since the all time high) in May 2015, I’ll just shut up. I’ve hammered this point home in recent days during the post Brexit vote rally. If you want to read my most recent thoughts, have at it from yesterday:
I $SPY With My Little Eye, Lower Highs
Markets climb a wall of worry, and despite the U.K.’s FTSE having made back all of its post Brexit losses (as has the SPX) most other European equity indices like the German DAX remain well below, as does Japan’s Nikkei. It seems that equity investors in those markets have different worries than those in the U.K. and the U.S.
But let’s not be fooled by the “scare-mongering rubbish” from the media (the words of Brexit Leave vote Muppet-Master Nigel Farage chastised CNBC’s Wilfred Frost on Tuesday). The larger issue is that the rate environment we live in, and the reasons for those historically low rates the world over are the signs of our collective worries.
The volatility in most major risk assets of late paints a fairly dire picture for the balance of the year in my opinion. This morning’s collapse in the 10 year U.S. Treasury yield to their all time lows is seen by some as bullish for equities. But really it says a lot more about global growth forecasts, and investor demand for safe haven assets:
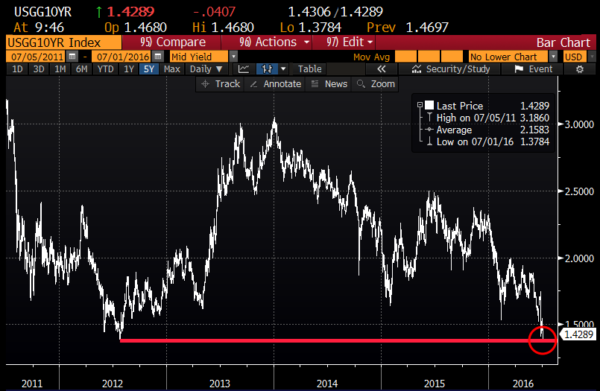
Take a look at the 16 year chart of the 10 year U.S. Treasury Yield. You’ll see how these dynamics change fairly dramatically at the tops of prior economic & equity market cycles:
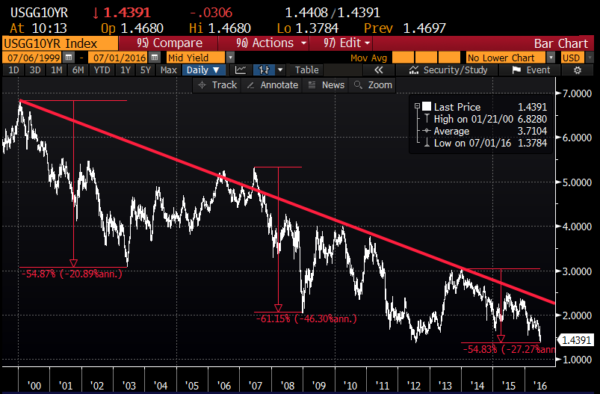
At the then all time highs for U.S. stocks leading into the dotcom implosion in 2000 (and 3 year bear market), the 10 year yield was nearly 7%, Fed Funds rate was north of 6%. By the 2003 lows in the SPX, the 10 year Treasury yield was halved, and Fed Funds went to 1% at their then lows.
This was sufficient to inflate another risk asset bubble, and by the SPX’s highs in late 2007, the 10 year yield was back above 5%, as was Fed Funds. At the lows in 2009, with the SPX having been halved, the 10 year yield went to 2% and Fed Funds to zero.
Today’s sharp drop to the prior 2012 lows should worry the heck out of you, it does me. Where do we go from here in the event of another financial crisis?? And whether or not you think sovereign bonds are the most epic risk asset bubble the world has ever seen, recent history has shown there is a bound below zero, and where that has occurred for sovereign debt it has not been bullish for equities in those regions.